This site uses cookies to improve your experience. To help us insure we adhere to various privacy regulations, please select your country/region of residence. If you do not select a country, we will assume you are from the United States. Select your Cookie Settings or view our Privacy Policy and Terms of Use.
Cookie Settings
Cookies and similar technologies are used on this website for proper function of the website, for tracking performance analytics and for marketing purposes. We and some of our third-party providers may use cookie data for various purposes. Please review the cookie settings below and choose your preference.
Used for the proper function of the website
Used for monitoring website traffic and interactions
Cookie Settings
Cookies and similar technologies are used on this website for proper function of the website, for tracking performance analytics and for marketing purposes. We and some of our third-party providers may use cookie data for various purposes. Please review the cookie settings below and choose your preference.
Strictly Necessary: Used for the proper function of the website
Performance/Analytics: Used for monitoring website traffic and interactions
TPM60CVA – Calculate Net Present Values – With CVA and DVA In Treasury and Risk Management, one can use the following functions for system to calculate NPVs (or fair values): Transaction JBRX – Single Value Analysis: NPVto calculate NPVs for financial transactions.
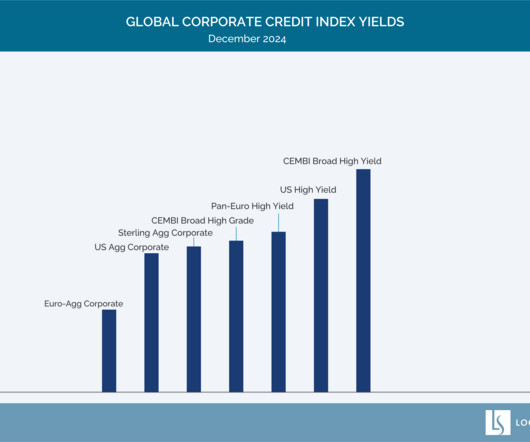
At Loomis Sayles, we like to look at the difference between spreads and expected credit losses from potential downgrades and defaults, known as the risk premium. The good news is that we expect relatively mild credit losses this year, with defaults likely to stay around 3%. Its a dynamic we're keeping an eye on.
Warning signs Reacting to the signals of problem loans A problem loan or credit is often identified as a problem asset due to a lack of repayment, a default, or the early identification of a cash concern with the borrower. Review: Are there any defaults under the loan documents? 2) Determine if the collateral is perfected (e.g.,
Those who are financially weak (high credit risk), in addition to essentially turning down the faucet for your cash inflow, present a higher risk of never paying for everything they owe. To receive new posts and support my work, please subscribe for just $5 monthly ($49 yearly). Do you need help improving cash flow?
Risk Mitigation – A seldom noted but important point is that a properly implemented program can reduce your risk of slow payment, fraud, and default within your portfolio. The post Credit Cards – Reducing the Cost of Acceptance – You hold the keys to success appeared first on The Credit Research Foundation.
Researchers find construction loans with more on-site inspections are less likely to default, suggesting that loan monitoring adds value to lenders. Takeaway 1 "Bank Monitoring with On-Site Inspections" will be presented later this month and claims to be the first empirical study of bank monitoring within non-syndicated loans. .
Besides driving process improvement, the experts at Your Virtual Credit Manager can apply default risk probabilities & other financial benchmarks to your AR portfolio to reveal actionable credit & collection insights. To receive new posts and support my work, please subscribe for just $5 per month ($49 yearly).
Although the menu navigation is good, it would be even better to have data presented on a single screen for review. By default, the Producer screen will have general information about the Producer as well as section defining the Producer to Vendor Relationships. Default Sort Order: Allows Records to be displayed in a particular order.
Unit 2 – Presenting the Solution Architecture and Components In this unit you will explore the high-level solution architecture of SAP Build Work Zone, gaining insights into its purpose of subscription and service. You’ll identify both the mandatory and default components of the advanced edition.
Today I would like to present you a custom class which enables usage of HTML Email Templates with SWN_SELSEN report. In my case the class inherits from the standard CL_SWN_MESSAGE_STD class, which is used by the SWN_SELSEN as the default message template handler (check the SWN_SELSEN configuration section below).
The default chart and table configurations can also be adjusted by user as per their need. Important Links and Resources Usage Rights SP12 delta presentation to get an overview of the changes and read the highlights blog Read how SAP Activate and Focused Build with SAP Solution Manager is working together ALM Community page
The default chart and table configurations can also be adjusted by user as per their need. Important Links and Resources Usage Rights SP12 delta presentation to get an overview of the changes and read the highlights blog Read how SAP Activate and Focused Build with SAP Solution Manager is working together ALM Community page
For data models with Multiple Account Hierarchies (MAH) we will only consume the default hierarchy as it’s a limitation with Geo Visualizations. This overwrites the settings of all filter tokens in the filter line but can be turned back to the default dimension setting.
Note: When adding new users, if license user type value is left blank, the system will default the type to Active. Select Import Data to import the file updated with records You may import as a background job or choose to run the job immediately or to schedule to run the job. Select Finish. It is not a real time report.
To fix the problem, we can change the default IDP of the subaccount. However, changing the default can break existing programmatic scenarios, test setups where password credentials are used already. IAS must be flagged as “default IdP” More about OIDC support in IAS. Side-Effects? How does the flow look? as described above.
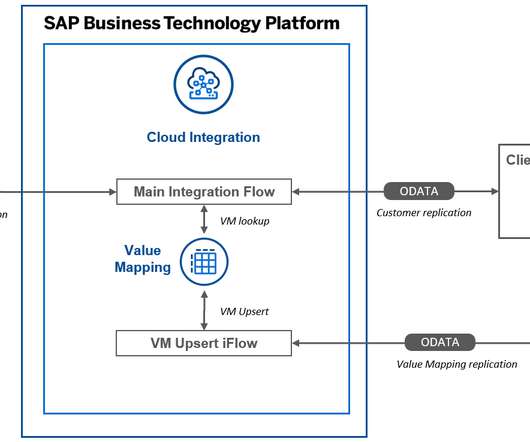
In this Blog I will focus on one field that is converted in such a way and will present the approach to maintain a VM object with external values using a separate scheduled process. You can also pull technical details of value mapping entries and set default values. . Setting default values for Value Mapping entries.
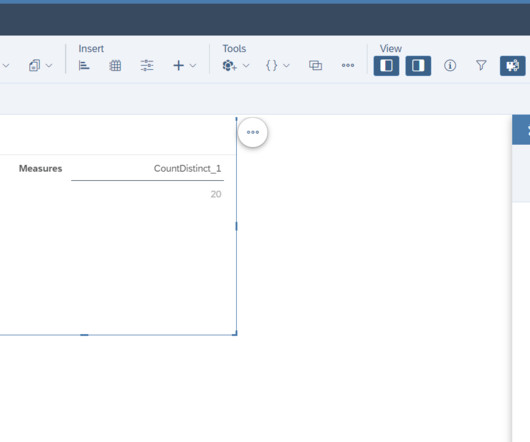
This will show the data from the countries which are not present in any of the regions created above using Restricted Cross Calculations. The only difference here is we can’t choose a single measure within selection context and by default the restrictions applies to all the measures within SAC instead of single measure.
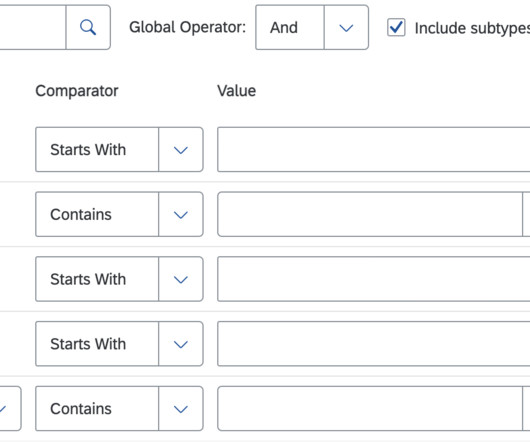
This is due to the fact that Azure SQL runs with collation SQL_Latin1_General_CP1_CI_AS in CCv2 and the queries are case insensitive in nature by default. With this change, the default contains behaviour will change to startswith. Tip #3 Ensure that right indexes are present. If you already have one, you can use that too.
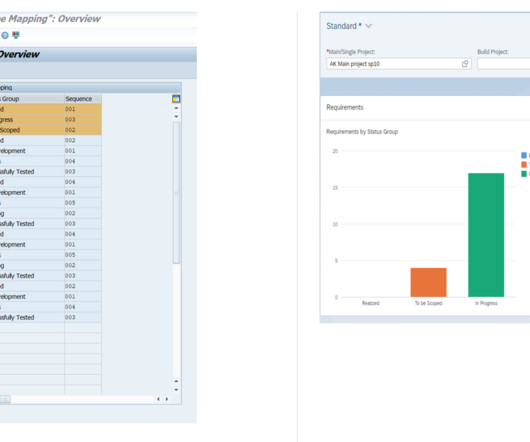
Detail Page for Work package By Default, the details page shows the work package count as the measure and the status of the work package as the Dimension. Changing the default settings The status groups can be customized and is explained as part of the pre-requisite blog above. This way the graph can be adjusted.
Understand and meet borrower expectations For community financial institutions (CFIs), small business lending presents both a challenge and an opportunity. Using probability of default models and data analytics can help banks identify strong borrowers more efficiently. Join thousands of your peers and sign up for our newsletter.
The default chart and table configurations can also be adjusted by user as per their need More filtering options can be added by using the “Adapt Filter” feature. The content of chart and table is based on selections made in filter bar. Users can create and save views using the variant management feature of the dashboard.
Detail Page for Work Package progress In addition to the overview page progress chart, the details page for work package progress by default shows the stacked column Chart with Extraction Date (Changed Date) and status group as the dimensions and Count of work packages as measure.
We anticipate limited downgrades and a very mild default rate of approximately 3.0% The chart presented above is shown for illustrative purposes only. Those estimates are likely to come down a bit, but we expect them to stay firmly in positive territory (unless theres a significant shock). Overall, corporate fundamentals appear solid.
It is available by default for newly created filters or it can be enabled on a per filter basis for existing filters in a story. There is a UI enhancement for displaying information in the tooltip, including the ability to use a dropdown menu to specify the default link. ID and description for dimensions presented in two columns.
Increasing complaints from customers about invoice discrepancies, unclear payment terms, or disputes suggest that you have systemic problems with the potential to create significant payment delays or defaults. Commensurate with a rising expectation of defaults, is a worsening of the quality of your AR portfolio along with profit shrinkage.
By default the added customer fields are hidden from the screen and you need to add it to the filterbar by clicking on Filters button and selecting them from the available filters list. Similarly for result list table the customer fields need to be added from table settings icon present at the table header.
Administrators can also add, remove or update the content of the excel to customise the presented information to their end users as long as the structure of the excel remains unchanged. The application reloads in the runtime adaptation mode. User Action Menu The UI Adaptation mode is selected by default.
For the former, ensure that the default Pause hotkey is not assigned to Space. Hopefully, combined with the official SAP Enable Now “escape the room” Christmas game, this will be a good present for 2023 from the SAP Enable Now geeks. You can review simulations in the Demo or Concurrent modes. Please find the video below.
Merge Logic for entities displayed on RHDR page: In most of the cases data from RCM (in case of first rehire check) or data from PDC (in case of second rehire check) would always take precedence over data present in the DB. Adjustment in previous record end date required.
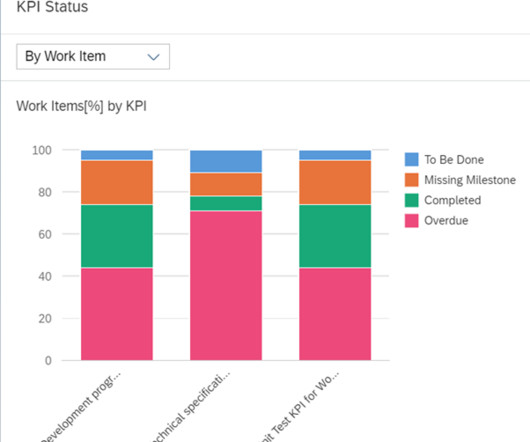
For more details on customizing refer this blog Detail Page for Work Item card By Default, the detail page shows the work item count as the measure and the status of the work item as the Dimension. The default chart type is Stacked Bar chart. This can be changed as per the need.
The issue was linked to a mismatch of default ADS configuration and PDF print forms (XDP forms by Adobe). Finding a path to success ADS instance was configured with default (out-of-the-box) parameters. That is with default configuration of producing PDF version 1.65. This version of PDF is compatible with Acrobat Reader 7.0.5
Visualization By default, a user can view both, chart and table together in a single page. The default chart and table configurations can also be adjusted by user as per their need More filtering options can be added by using the “Adapt Filter” feature. Users can as well sort the fields.
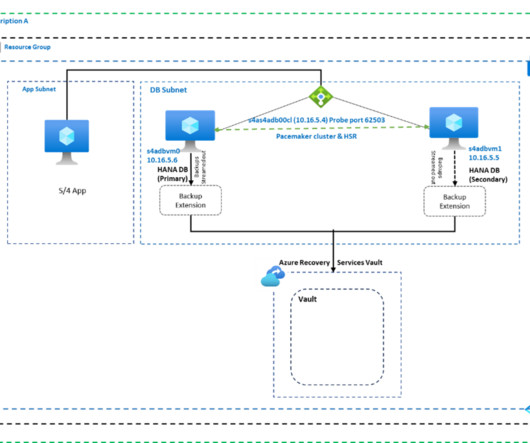
Overview of deployment steps This article shows how to perform restore of SAP HANA databases present in same region under two different subscriptions on the same tenant using Azure Backup. Cross Subscription Restore is enabled by default at the Recovery Services Vault when it is deployed part of Azure Backup configuration.
Steps to configure the solution readiness dasboard There are couple of reports that needs to be executed as default step in the Solman set up. Solman Setup- Manual Activity for Dashboard configuration 1. Once we execute this report, the default measures and dimensions are set.
Except for your obligation to protect confidential information, this presentation is not subject to your license agreement or any other service or subscription agreement with SAP. The information in this presentation is not a commitment, promise or legal obligation to deliver any material, code or functionality.
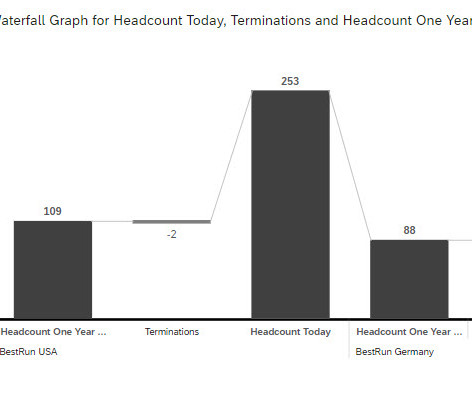
Of course, it is easily possible to enhance the presented approach by further aspects, e.g. To consider both, involuntary and voluntary turnover rates Top Talent turnover rate Turnover rate by additional dimensions like Department, Manager, Position Level, Pay Grade, Gender, Age Groups, Length of Service and many more.
His presentation covered the current commercial real estate (CRE) performance and a look at the future of CRE. McBride’s presentation primarily covered the pandemic's impact on CRE. Here we have summarized the main takeaways from the session. Retail inched up to the 1.5% So, what does this all mean?
Overall Status card On initial load, the card shows only the rows that fit the default card size and on the right top corner, the row count is displayed. Here we have used a table card to display the detailed group of information.
Default SAP Support User Role Enhancement Administrators can now specify the Default SAP support user role at a more granular level. This will better facilitate the handling process for Support User role requests.
To manage the risk that a customer might default, companies implement credit and collection policies and procedures. The experts at Your Virtual Credit Manager have default risk probabilities and other financial benchmarks for analyzing your AR portfolio and revealing actionable credit & collection insights.
For each of these key figures, you can configure three different key figures to separately manage initial defaulted values, manual adjustment values, and final values. It helps supply chain leads analyze typical supply chain risks and collaborate with planners to eliminate them.
New Tax Regime to be considered as the default tax regime, while an option to choose Old Tax Regime should be made available. New Tax Regime to be considered as the default tax regime, while an option to choose Old Tax Regime should be made available. All the employees will now be under New tax Regime by default.
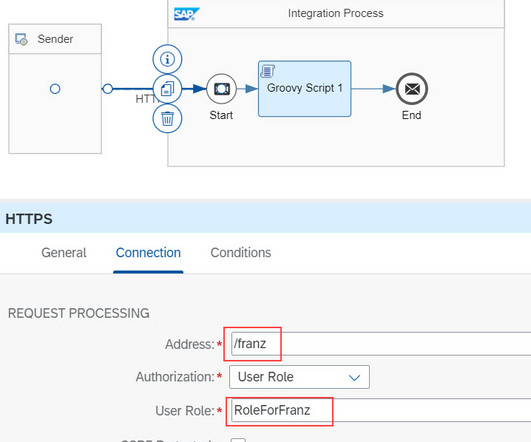
Click Create present on the top right corner of the page. Clicking the I-Flow will open up the default template. The default value proposed is likely the correct value, but if you need to confirm; the value can be found in the SAP BTP cockpit at the Subaccount level. Create a custom Integration flow in CPI.
We organize all of the trending information in your field so you don't have to. Join 5,000+ users and stay up to date on the latest articles your peers are reading.
You know about us, now we want to get to know you!
Let's personalize your content
Let's get even more personalized
We recognize your account from another site in our network, please click 'Send Email' below to continue with verifying your account and setting a password.


Let's personalize your content