This site uses cookies to improve your experience. To help us insure we adhere to various privacy regulations, please select your country/region of residence. If you do not select a country, we will assume you are from the United States. Select your Cookie Settings or view our Privacy Policy and Terms of Use.
Cookie Settings
Cookies and similar technologies are used on this website for proper function of the website, for tracking performance analytics and for marketing purposes. We and some of our third-party providers may use cookie data for various purposes. Please review the cookie settings below and choose your preference.
Used for the proper function of the website
Used for monitoring website traffic and interactions
Cookie Settings
Cookies and similar technologies are used on this website for proper function of the website, for tracking performance analytics and for marketing purposes. We and some of our third-party providers may use cookie data for various purposes. Please review the cookie settings below and choose your preference.
Strictly Necessary: Used for the proper function of the website
Performance/Analytics: Used for monitoring website traffic and interactions
Introduction This blog is part of the blogs series for the new “Solution Readiness Dashboard” delivered as part of Focused Build SP12 delivery. By default, risk state filter (value = “Open” ) is applied, which would display open risks. These default settings can be changed and also, chart type can be changed.
Introduction This blog is part of the blogs series for the new “Solution Readiness Dashboard” delivered as part of Focused Build SP12 delivery. By default below filter fields are displayed on the detail Page. The chart used here is “Stacked Bar Chart” by default.
Introduction This blog is part of the blogs series for the new “Solution Readiness Dashboard” delivered as part of Focused Build SP12 delivery. Filters: By default, below filter are displayed. This blog focuses on the overview page and Detail page of the Issue card. ALM Community page
Introduction As part of the latest Service Pack (SP12) of Focused Build for SAP Solution Manager, we are delivering the latest version of solution readiness Dashboard built using the standard SAP Fiori Elements. This blog is part of the blogs series for the new “New Solution Readiness Dashboard.”
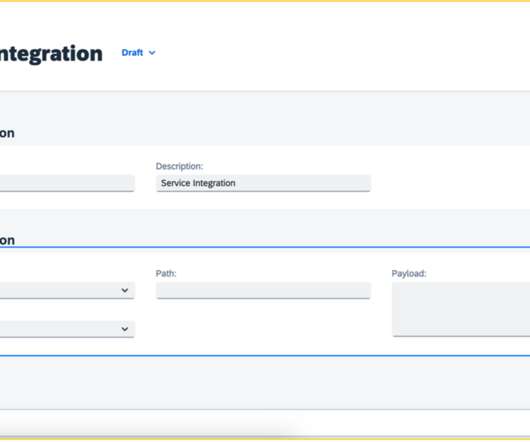
I will demonstrate how to build a dashboard converting natural language questions into data visualizations using only a minimal amount of code. turbo-0613 by default, which is apparently already good enough for this type of code generation. The dashboard starts with displaying an input box for the natural language query.
Introduction This blog is part of the blogs series for the new Solution readiness dashboard delivered as part of Focused Build SP12 delivery. The default chart and table configurations can also be adjusted by user as per their need More filtering options can be added by using the “Adapt Filter” feature.
Introduction This blog is part of the blogs series for the new Solution readiness dashboard delivered as part of Focused Build SP12 delivery. The default chart and table configurations can also be adjusted by user as per their need. Users can create and save views using the variant management feature of the dashboard.
Introduction This blog is part of the blogs series for the new Solution readiness dashboard delivered as part of Focused Build SP12 delivery. The default chart and table configurations can also be adjusted by user as per their need. Users can create and save views using the variant management feature of the dashboard.
Track your approval ratings and contrast them to your accepted default rate. Align your corporate goals to your results by building a dashboard to measure your results. Measuring Success Measure your turnaround time pre- and post-implementation.
Select ‘ Set as Default’ if this view shall be pre-selected the next time you enter the case list. Connected blogs: Why choosing the right system and product will help resolve your product issue faster New ‘Get Support’ Application and Structure of Services & Support Dashboard Goodbye SAP ONE Support Launchpad!
Introduction This blog is part of the blogs series for the new “New Solution Readiness Dashboard” delivered as part of Focused Build SP12 delivery. Detail Page for Work package By Default, the details page shows the work package count as the measure and the status of the work package as the Dimension.
Introduction This blog is part of the blogs series for the new Solution readiness dashboard delivered as part of Focused Build SP12 delivery. The default chart and table configurations can also be adjusted by user as per their need More filtering options can be added by using the “Adapt Filter” feature.
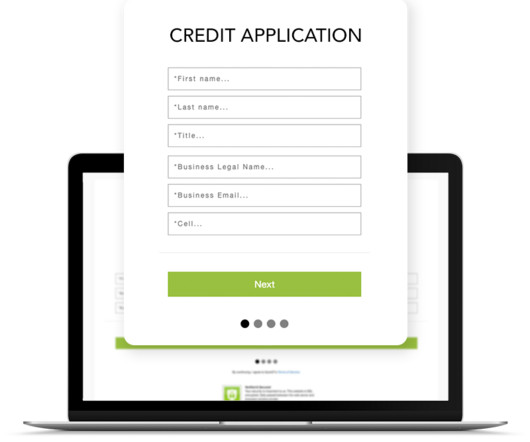
Driving Value with Digital Transformation: The transformative journey eliminates paper and postage costs, reduces the cycle time for application reviews and approvals, and introduces a dashboard for real-time visibility. This efficiency allows for resource redeployment to higher-value work, all while minimizing customer default risk.
This blog is part of the blogs series for the new “New Solution Readiness Dashboard” delivered as part of Focused Build SP12 delivery. For example, if In April 2023 I have 3 work packages in successfully tested and in May 2023 I have 3 work packages in successfully tested, then the chart shows 6 work packages for the month of May 2023.
Introduction This blog is part of the blogs series for the new “New Solution Readiness Dashboard” delivered as part of Focused Build SP12 delivery. Overall Status card On initial load, the card shows only the rows that fit the default card size and on the right top corner, the row count is displayed.
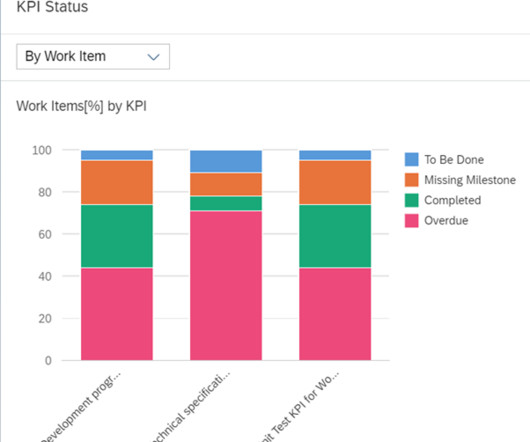
Introduction This blog is part of the blogs series for the new “New Solution Readiness Dashboard” delivered as part of Focused Build SP12 delivery. The default chart type is Stacked Bar chart. By default, it shows the graph as a Stacked column chart with Work item count as measure and project and status as dimensions.
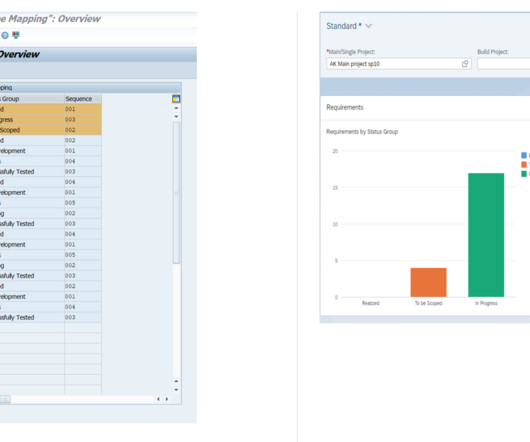
Requirements Overview Card and Requirements Analytical List Page Introduction This blog is part of the blogs series for the new Solution Readiness Dashboard (SRD) delivered as part of Focused Build SP12 delivery. Visualization By default, a user can view both, chart and table together in a single page.
Under the Kyma Environment section, you will find a link to your Kyma Dashboard and most importantly, you will be able to download the KUBECONFIG file to configure your kubectl so that it points to your cluster in the Kyma runtime. Kyma Dashboard. Once logged in, select the default namespace from the dashboard toolbar.
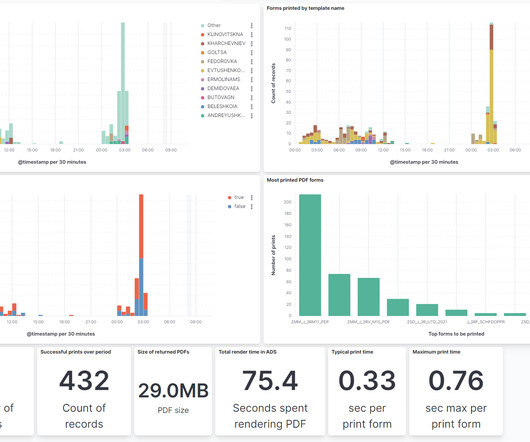
This blog article explains how we managed to connect ELK to ADS and build a dashboard over ADS logs. This note outlines that if you have compatible ADS release a log entry under location “ com.adobe.Monitoring ” is generated every time a PDF form is being printed but not written to the log by default.
A chemical distributor did just this by providing their Salesforce with a dashboard to monitor each region’s receivables portfolio. it just might help them pay you sooner! Share A Case in Point A parts distributor was having difficulty with collections and high dispute volumes.
Choose Default Name ID Format. Therefore, we can configure Embedded SAC module in SAP DMC solution that brings together data and analytics to define a Data Source/model which helps in creation of Stories/dashboards to display the data. Choose Subject Name Identifier. Under Basic Configuration, select E-Mail as basic attribute.
While a newly generated HDI user comes with default roles and privileges, they are unable to initiate the virtual table creation process without prior assignment. Introduction We will explore the creation of virtual tables that mirror tables in a remote data source. This assignment must be completed before the user can proceed.
Firstly, within the Kyma dashboard you need to create a new namespace, once created go to ‘Service Management’ > ‘Service Instances’ and select ‘Create Service Instance’ (7). Creating a service binding within your Kyma environment Within the Kyma Dashboard, navigate to your newly created instance and select ‘Create Service Binding’.
For data models with Multiple Account Hierarchies (MAH) we will only consume the default hierarchy as it’s a limitation with Geo Visualizations. This overwrites the settings of all filter tokens in the filter line but can be turned back to the default dimension setting. This feature is available as of June 28, 2023.
Default action” is used by the processor to determine which main action needs to be triggered for an incoming event. Only one default action can be defined in modeler. Processes ‘Default Action’ to determine which business actions (Main Action) needs to be processed. See the screenshot below in Figure-8 for Monitoring Dashboard.
SAP for me Navigation to Remote connection: The card can be access from SAP For Me Systems & Provisioning Dashboard Connectivity Tab Remote Connection card The key KPI (Key Performance Indicators), which is the total number of open connections across all your systems, is displayed immediately on the Remote Connection card.
Set the default eDoc generation type: Not Relevant Generate – The digital signing process is triggered automatically. Optional: set a default eDoc generation type per customer in the customer’s business partner master data → eDocs tab. Generate – Later – The digital signing process is triggered only manually.
Dashboard & Story Design. Dashboard & Story Design. It is available by default for newly created filters or it can be enabled on a per filter basis for existing filters in a story. Freeze column headers (default). Removed default row limit. Version 1.0.353 for SAP Business Warehouse (BW).
Queues Go to Event Mesh Dashboard, Create your own Queue name Click on Actions for additional details for your Queue created View Queue Details shows required information for messaging Test Publishing or Consuming Messages If you want to publish a messages to a queue or consume messages from a queue.
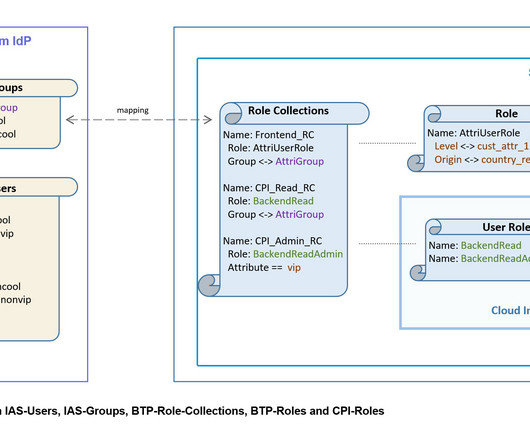
To fix the problem, we can change the default IDP of the subaccount. However, changing the default can break existing programmatic scenarios, test setups where password credentials are used already. IAS must be flagged as “default IdP” More about OIDC support in IAS. Side-Effects? How does the flow look? as described above.
As we have now merged Story and Analytical Application, we have now renamed the categories as: Dashboard & Story Design is now Story Design Analytic Design is now Story Extensibility Microsoft Office Integration Exclude in Member Selector Users can now select and exclude dimensions in the member selector.
Default SAP Support User Role Enhancement Administrators can now specify the Default SAP support user role at a more granular level. SAP Road Map Explorer ) License Usage Limits We are introducing an important change to license usage limits in SAP Analytics Cloud.
Default favorites will be displayed on the right side of the Start Page. Additionally, default filter selections are provided making access to vital information and analysis easier and faster. For dashboards , we introduced the process view switcher. Process models can now also be linked to dashboards.
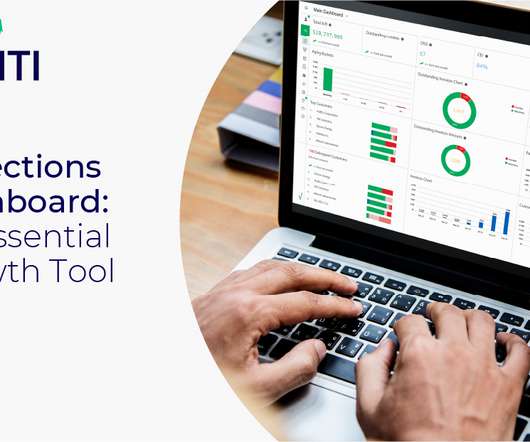
It also gives companies the ability to move away from manual tracking in spreadsheets, to a real-time dashboard, which saves time and gives a full and reliable visualization of the current state of collections. So, how can using a collection dashboard help, and why is it so indispensable as a growth tool?
Please keep the Project Id with you which is available in Google Cloud Dashboard. By default, API keys are unrestricted. The ABAP SDK for Google Cloud by default retrieves only the latest version of a secret. Billing is enabled for your project. See how to confirm that billing is enabled for your project.
There will be a default AMQP channel which comes along with the installation stop it and use our configured AMQP channel. Step-1: Install the IBM MQ 9.2 This is for the reason of handling the queues explicitly.
It provides a large set of default connections to access data from a wide range of sources, which might be in the cloud as well as on-premises, or from SAP as well as from non-SAP sources or partner tools. In the overview dashboard of your SAP Cloud Platform Integration Tenant, Choose Monitor > Integrations and then Security Material.
Any new functionality I want to add to the program, e.g. display a dashboard, the status of a device, a quote, a message, etc., If there aren’t new entries there’s no need to refresh what’s on display. I refer to the script below as the skills script.
When you open SAP Companion, the default view is for context-sensitive help. The help panel includes information that’s relevant for the page you’re looking at. A link tile provides access to the documentation on SAP Help Portal. Let’s check out the Manage Taxonomy app.
The business rule that is introduced is “Allow suppliers to edit quantity in line-item price adjustment credit and debit memos” and is not checked by default. You can then choose to respond to your matched postings. Buyers will review all the responses they receive and notify you when they make a decision.
CDNs allow for granular cache policy management through a user-friendly dashboard, relieving you of the need to manually tweak individual headers. CDNs and Cache-Control The variety of caching headers can make manual cache management overwhelming. These are versioned for every deployment */main-es2015.485e6be0b90a105b7f18.js
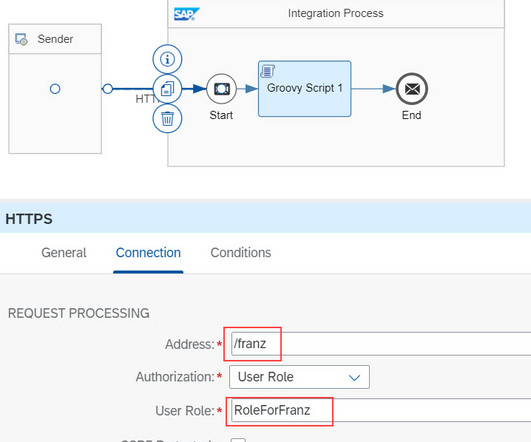
CPI: Roles: In the CPI dashboard, we define 2 roles which are used to protect the access to the iFlow endpoint and to fine-tune the flow. However, the roles must have been created beforehand in the CPI dashboard. When creating the service instance, a default role was generated, but incomplete.
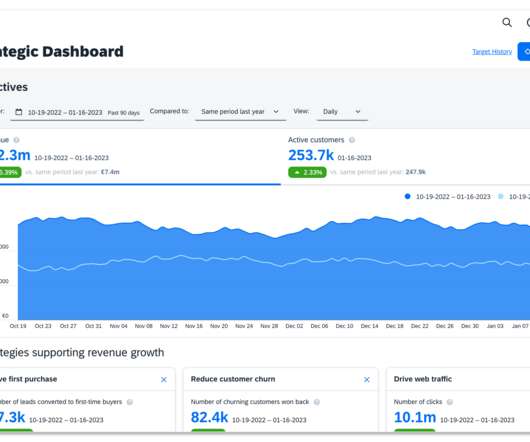
Figure 11: SAP Emarsys Customer Engagement strategic dashboard. The highlights I’ll be introducing below are: Spaces and Pages out of the box – new default, all key roles supported. As a result of the above, we have now made spaces and pages the default for all new SAP S/4HANA Cloud, public edition systems.
Log in to Ariba Buying solution Go to parent realm Dropdown Manage on the dashboard Click on Core Administration Dropdown Supplier Manager Click Supplier Search active supplier by name or system ID Click Action and Edit Click Organisational ID’s Update ANID with suffix-t Click SAVE Catalog Activation: Supplier uploads.cif file in their AN account.
We organize all of the trending information in your field so you don't have to. Join 5,000+ users and stay up to date on the latest articles your peers are reading.
You know about us, now we want to get to know you!
Let's personalize your content
Let's get even more personalized
We recognize your account from another site in our network, please click 'Send Email' below to continue with verifying your account and setting a password.


Let's personalize your content